
3. Representation and Inter-Urban Comparison
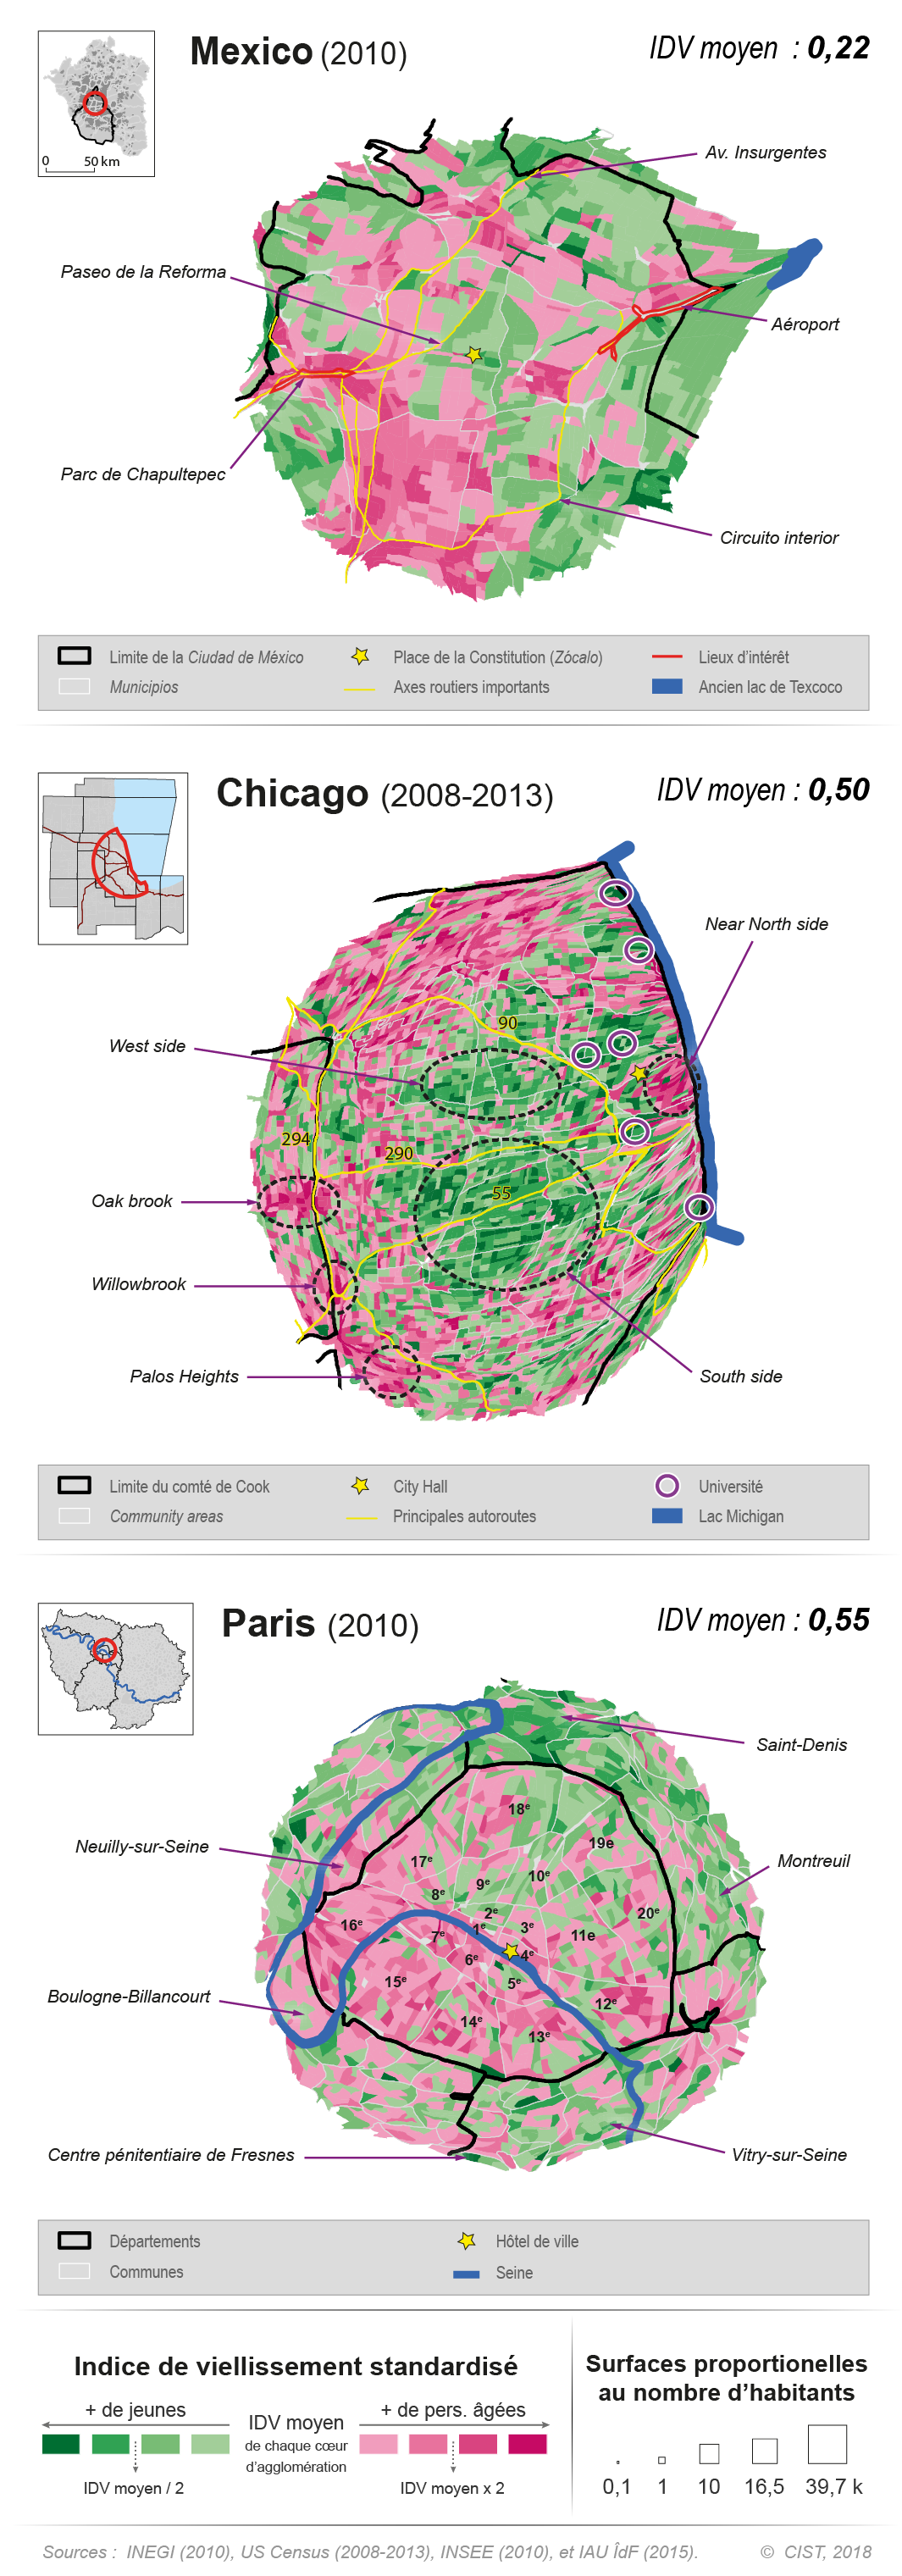
How should we go about representing and comparing, for example, population ageing in Paris, Chicago and Mexico City when they have different surface areas, population masses and available variables? For both demography and land use, the first problem is the harmonisation of the data (delimiting age groups, insufficient accuracy, etc.). However, even once we have overcome this challenge, a cartographic comparison of the demographic structures reveals at least three obstacles. First, the readability of spatial configurations is difficult for the central zones –even though they are the most highly populated. Second, the Euclidean metric reveals its limitations when the geometries, surface areas and densities are part of distinct urban models. In other words, measures of distance between spatial features do not compare between the South American, North American and European cities. Third, differences in data structure are often clearly visible according to the current stage of demographic transition.
To overcome these obstacles, we develop a series of options to make the selection and mapping of comparable spaces and variables possible. First, we analyse only the populations included among the first 5 million people living closest to the centre [1] , which we propose calling the ‘urban core’. This makes the reference frames comparable in terms of population masses. Second, we replace the Euclidean metric with anamorphic representations to highlight the main spatial structures that emerge from the analysis of demographic data by minimising the effects of distance to the centre in sprawling cities. In a continuation of Stouffer’s work (1940), an intervening opportunities approach is only possible when the distance between two ‘social’ units is measured, that is when the mass of inhabitants, as opposed to the number of kilometres (or access time), between two points is calculated (Grasland, 2010). Finally, calculating comparable indexes using the available demographic data highlights internal socio-spatial differentiations and enables case study compari- sons. For example, an ageing index (defined as the ratio of the number of people aged 60 and over to the number of people aged under 25), which was standardised using the means and standard deviations for each of the three cities, allows a rigorously comparable interpretation of the social division of space according to this input in all three cases. By combining these three options (urban core, anamorphosis and standardised index), we are able to produce not only a comparative framework, within a common reference, of the demographic structure of the three cities but also a detailed analysis of their internal urban structures (Fig. 3).
The methodological options proposed here do not, however, eliminate the impact of variation in the sizes of statistical units (MAUP effect, Modifiable Area Unit Problem, see Madelin et al., 2009). Data smoothing or data aggregation methods would no doubt make it possible to better harmonise representations, but this would be at the expense of detail.
The comparative analysis also raises other methodological problems, such as the readability of spatial information. For some thematics, such as intra-urban mobility, systematic data mapping acts as a barrier to visual comparison. In Mexico City, for example, the mass of information is just too large to present (5,700 potential links) in a representation of residential mobility between the 76 municipalities that make up the city. This impeds any global interpretation of the trends that structured the city and, more especially, any population redistribution pattern comparisons with other cities. One possible solution to simplifying the interpretations of trajectories and making them comparable consists in aggregating the cities into coherent and recognisable sectors, thus allowing a schematic modelling of the dynamics observed. Aggregation can be based on social, economic or functional criteria (Duhau, 2003) or on global approaches resulting from urban studies specific to each city (Valletta, 2014). In Mexico City, for example, cross-tabulating the following three variables produces sectoral divisions that can be reproduced in other contexts: i) the dates when the municipalities were annexed by the city, which is at the root of the classic concentric zone model interpretation of cities (CONAPO, 1998; Sobrino & Ibarra, 2008); ii) the administrative situation (Mexico City v. State of Mexico); and iii) the geographic situation (cardinal points and geographic centrality –without reference to urbanity) (Fig. 4).
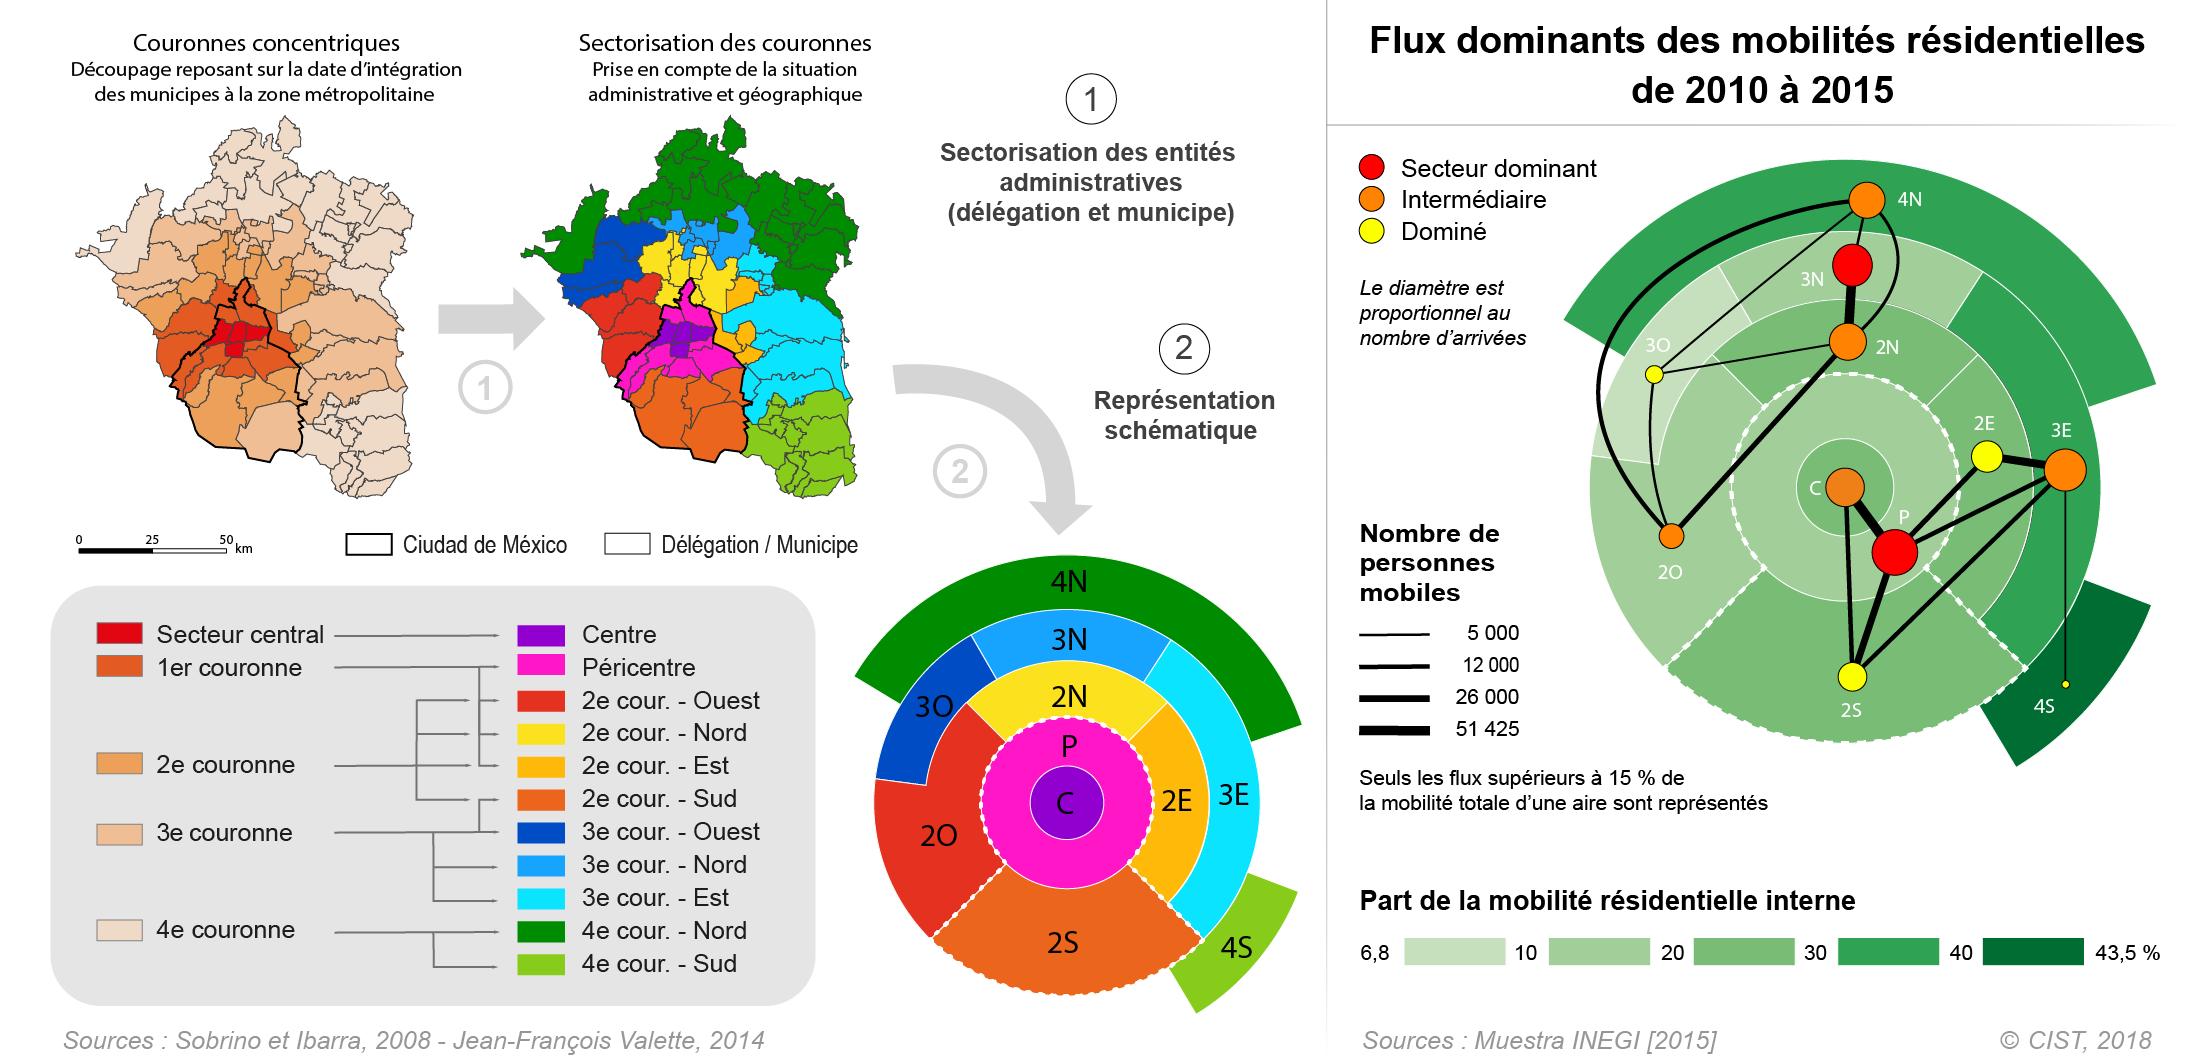
This schematic representation of data aggregated into sectors makes it easy to identify the dynamics (centrifugal and centripetal) of residential mobility in a city and to compare them with other cities.
[1] ‘Centre’ here refers to the city’s historic centres (Zócalo in Mexico City, City Hall in Chicago, Hôtel de Ville in Paris). We are aware that identifying such ‘urban cores’ may be problematic for other cities.