
4. Cross-Tabulation and Intra-Urban Analysis
Comparing heterogeneous data at intra-urban level also presents methodological challenges. Such comparisons are nevertheless important for the light they can shed on the complexity of the phenomena at work by interfacing thematics that are often analysed separately. Comparing zonal data (censuses), cadastral data (land cover patterns) and disaggregated individual data (real estate transactions) for a particular territory could, for example, lead to more detailed analyses of the internal diversity of a space. The question of data interoperability is becoming increasingly relevant with the profusion of digital traces (Severo & Romele, 2015), that is data from connected objects (Louail et al, 2014), social networks and internet service platforms (runners’ GPS log [2], short-term Airbnb rentals [3], etc., Guitterez et al., 2016).
During the project’s workshops, we explored the real estate thematic using data from insideairbnb.com, a website offering scraped data from the Airbnb rentals’ database on a number of dates for different cities (in addition to those initially retained). In a move away from the use of perimeters, which are often not very comparable (either at municipal level, as in Paris and Chicago, or at city level, as in Greater London), a preliminary analysis showed: i) differences in the structures of Airbnb rental supply in cities (for example, private rooms are more common in Barcelona while entire apartments are more prevalent in Paris); ii) the existence of covert agencies (seen in the number of rentals available for more than 6 months per year, especially in Chicago); and iii) the diffusion of the phenomenon over time (Fig. 5).
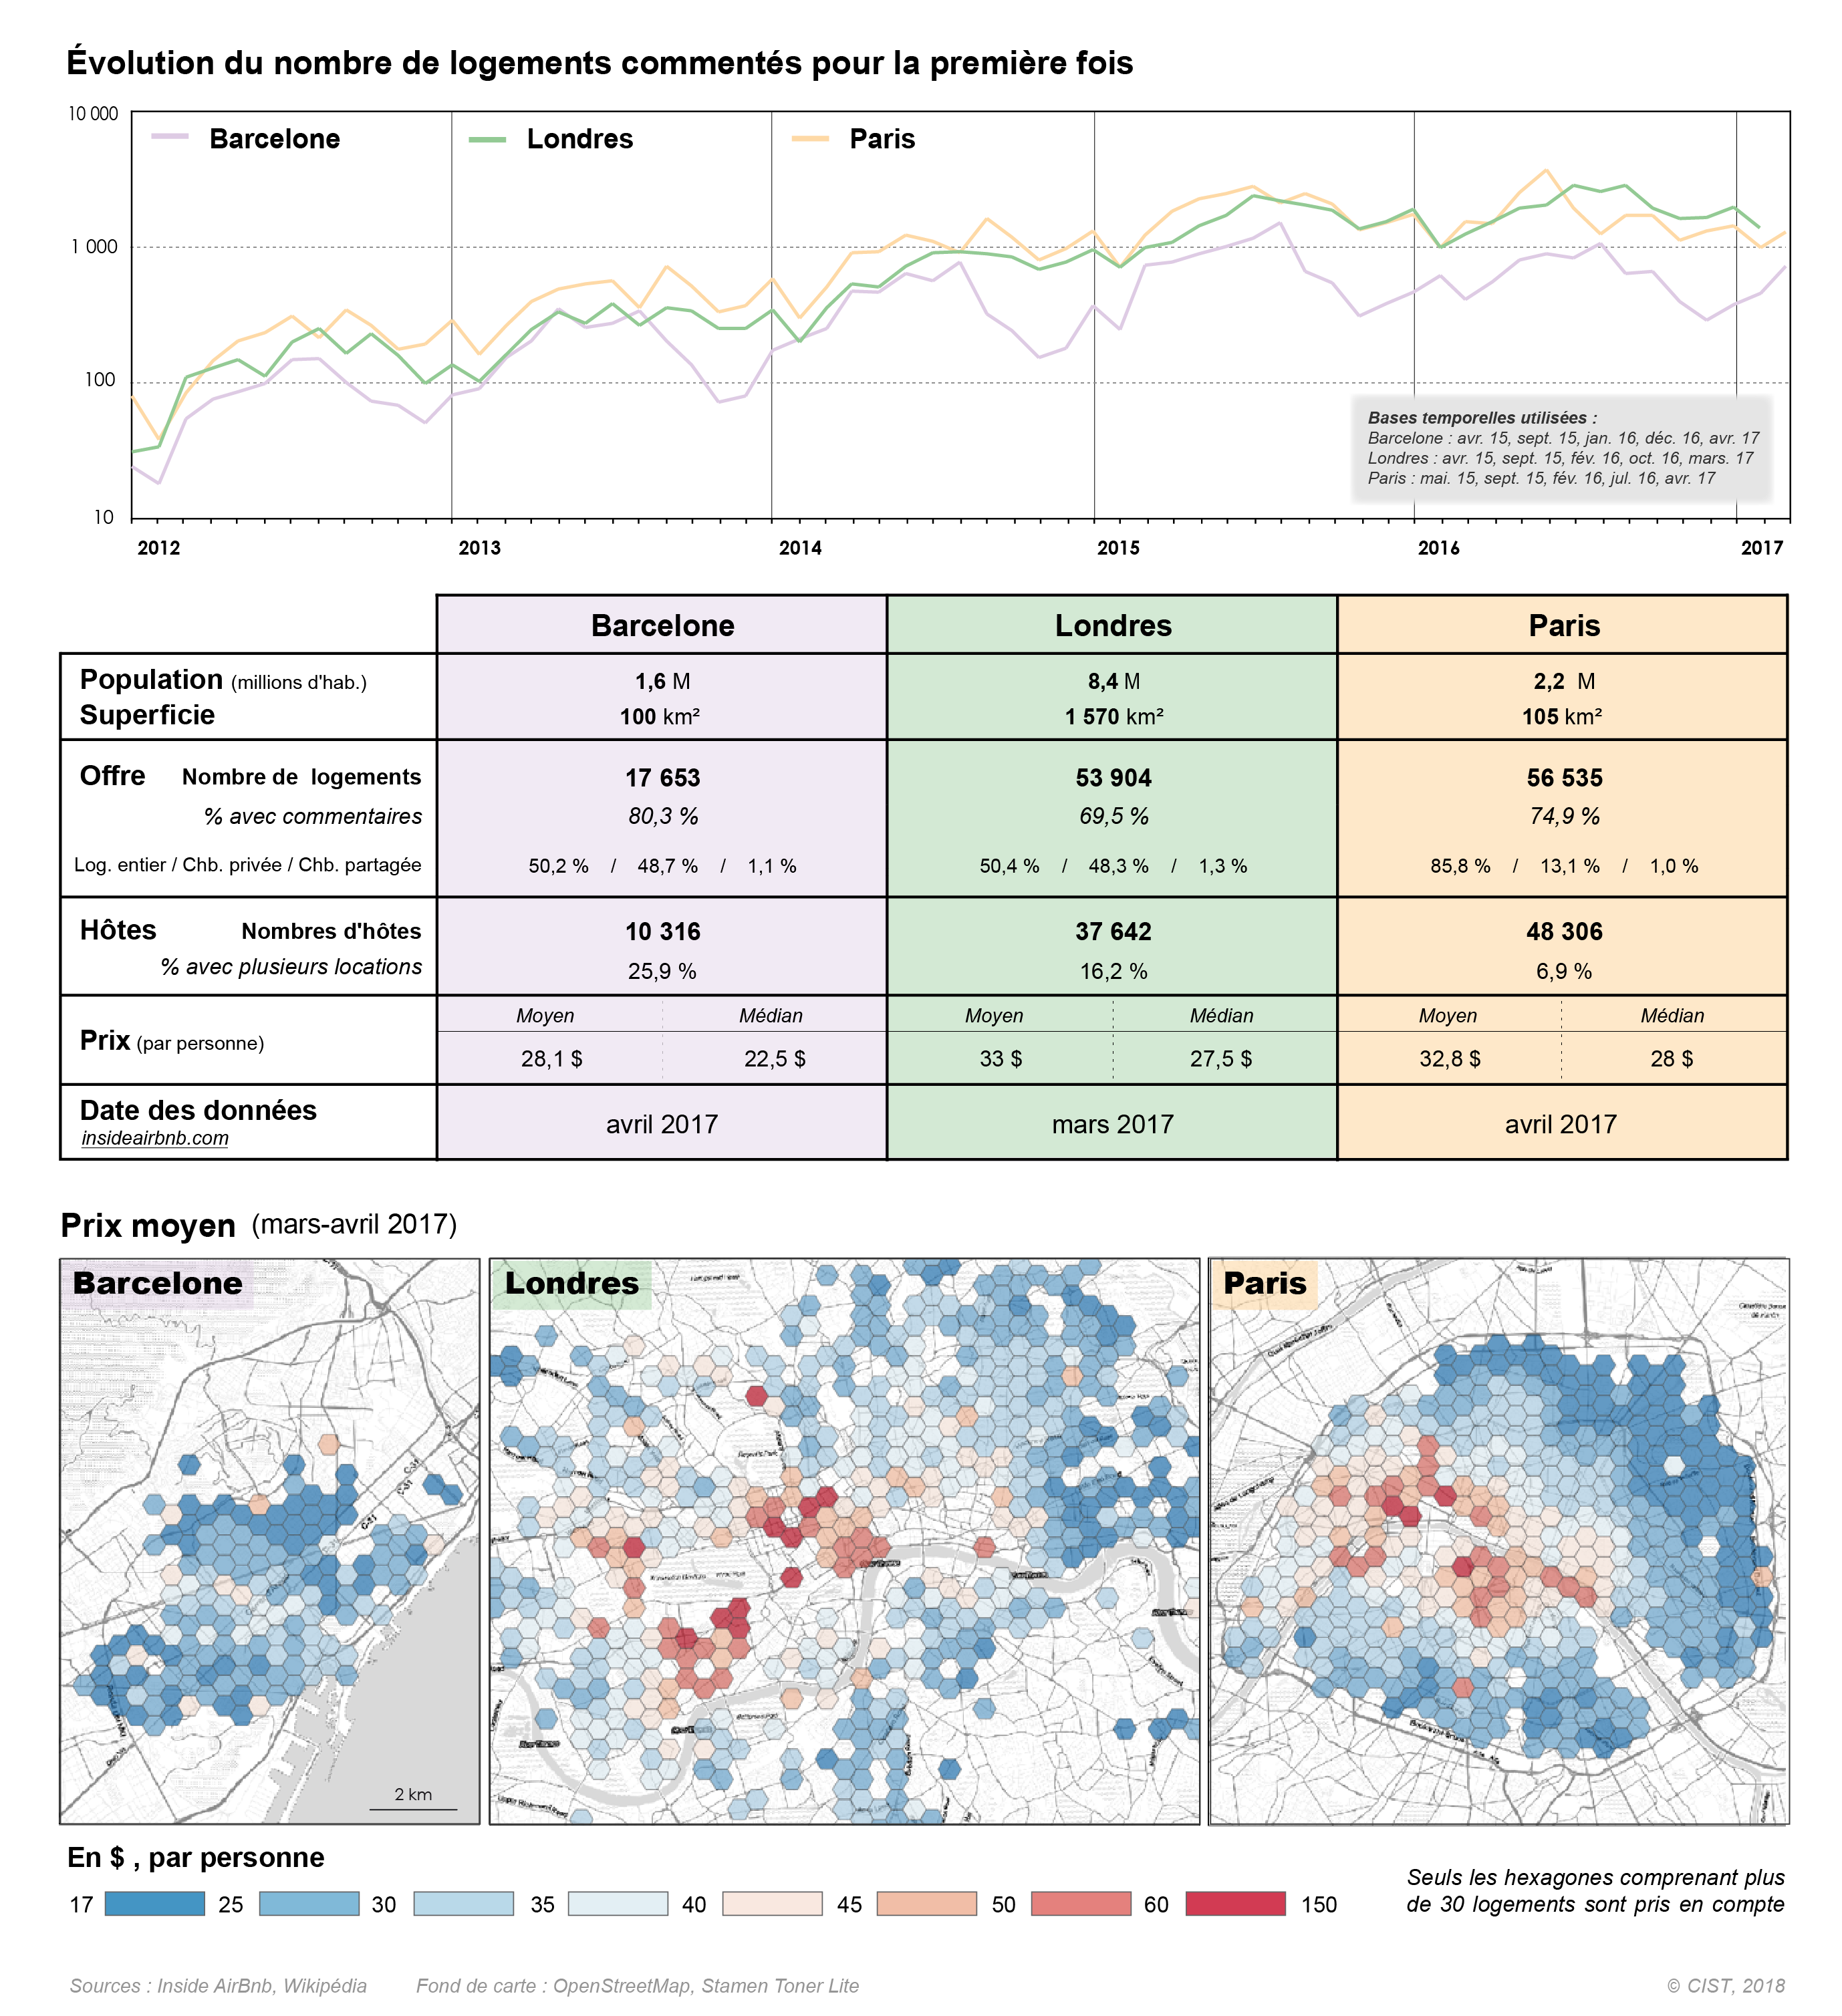
Comparing these local data depicting real estate market conditions based on Airbnb rental offers with real estate transactions data (property purchases) again raises problems relating to the MAUP effect and the reference grids used. Comparisons can, for example, be made using a grid or an interpolation model based on the probability that similar properties nearby will be comparable in terms of price per square metre given this is how market prices are determined (Guérois & Le Goix, 2009). These data comparisons also raise questions on the temporal harmonisation of datasets. It can be inferred here that comparing real estate acquisition markets for the whole of 2012 with rental markets resulting from scrapping in 2016 is a reasonable proposition.
In addition to the methodological problems of interoperability, comparing heterogeneous data also means determining exactly what is required from the data. While inter-urban rankings are often based on property prices (Fig. 5), other questions seem more relevant when comparing fine-grained data collected from Web 2.0, such as the impact of changes to economic orders (in this case, temporary rentals) on internal metropolitan dynamics and therefore also on socioeconomic inequalities, which are likely to increase (e‧g. in terms of access to housing). As an example in the Parisian case, a comparison between the Airbnb data and the fine-grained data from real estate transactions [4] in order to to analyse the spatial structures of prices and transaction density in the city. The results showed an extremely strong correlation between property prices and Airbnb prices for 2- to 6-room apartments in Paris, with the Airbnb prices being modelled from the property prices. The two pricing systems are obviously linked by land rent and locational rent [5]. However, an analysis of the densities shows that, although still correlated, there is a greater variance in the spatial structure of these two dimensions of real estate pressure in the city (Fig. 6). While the densities of Airbnb supply and apartment sale transactions highlight the neighbourhoods in which these two markets are most dynamic (N and NE of Paris), the regression model and residual analysis show the neighbourhoods that are experiencing particularly strong pressure on their real estate markets from the Airbnb supply. This dynamic results in a shortage of apartments available for private accommodation in the centre of Paris (from the 2nd to the 6th arrondissements), the Saint-Lazare Montmartre district and the 8th arrondissement (Fig. 6c). Hence, internet data can reveal recent changes in urban spaces that are sometimes not very visible through the more traditional data.

[2] Where People Run in Major Cities.
[3] See in particular the work of the ‘Net (h) no-graphies’ group [online].
[4] Base BIEN Chambre des Notaires d’Île-de-France, LabEx DynamiTe 2014–2017’s operating agreement.
[5] Relationship evaluated using a linear regression model such as: PrixAirBnB2016 = 0,004197 x PrixApt2012 - 5,216 ; r2 = 0,87.