ITAN in brief n. 11, What Inclusive Growth in the Neighbour Territories, October 2014

Figure 1 compares GDP per capita in three major world regions. In East Asia, Dragons clearly caught up with Japan, and developing countries (including China) are progressively bridging the gap. In the Americas, emerging and developing Latin America does not fill the gap vis-à-vis the US, but the latter experience a rapid GDP per capita growth, and Latin America is at level 25 (Mexico excluded, 100=USA). In the European region, apart from Israel and Turkey, the gap remains huge: Arab Mediterranean Neighbour countries hardly reach a level of 20 (Eurozone=100).

ITAN composite indicators provide key information to assess the insufficiently inclusive development of the Neighbour territories. To begin with, simple classic indicators, such as education and income, shed light on the sharp territorial disparities in the Neighbourhoods, on three scales: macro-regional, national, local. Education is a key condition for inclusive growth. Map 1 shows that south-eastern Europe lags behind. So do Mediterranean Neighbours yet they have managed rapid progress in school enrolment. Still, many difficulties remain in particular in rural areas, in particular for women, and in particular for people over 30 years.

The employment issue is particularly worrisome in the South and East Mediterranean partner countries where 28% of the young active are unemployed. A large proportion of graduate young adults cannot find any job, due to the inadequacy of the training system to labour market and to the scarcity of job creation in these countries. It should be added that a lot of young people drop out school without finding any job. As a result, more than 40% of the 15-24 year old Moroccans are allegedly neither at school nor at work.
An unexpected concern is about young girls: in secondary school, they happen to be now much more enrolled than their elder but also than their masculine counterparts, because at this stage boys all too often drop out; the contrast is incredibly high between the over-representation of girls in secondary school and the under-representation of women on the labour market (in particular out of metropolitan areas) because young women access to labour confront a lot of obstacles. This suggests a rising concern of South Mediterranean women, when these numerous educated girls will be looking for –lacking– jobs. This contrast is particularly strong in eastern Algeria and in its largest cities –Algiers, Oran, Constantine. Generally speaking, the contrast between western Europe and the Mediterranean Neighbourhood is one of the highest among all the indicators; this means that potential cooperation in that field is boundless.

Very much related to the previous indicator are incomes. Map 3 shows the gap between Russian, Israeli and western Turkish territories on the one hand, and almost all other European Neighbour Regions on the other. Again, the issue of internal inequality proves relevant, particularly in Turkey, Egypt, Algeria and Tunisia where the opposition between littoral and/or capital city area and the inner territories is impressive. In the Near-East, the contrast between Israel and the rest of the area is a part of the geopolitical mix. In the Western Balkans, Bosnia and Herzegovina and Albania appear as the most unequal countries (we do not have regional data for Serbia). In Ukraine the contrast is strong between the capital city and the rest of the country where income seems evenly low.

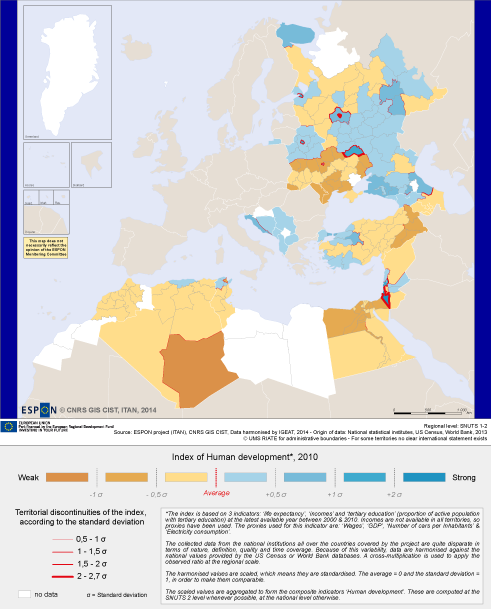
The evolution of the Human development sums up the previous analyses and provides further information. The ITAN project carried out an analysis at macro-regional scale, at national scale and at local scale thanks to a local Human Development Index (HDI). Eastern Neighbours are recovering after its harsh 1990s decade, and Mediterranean Neighbours keep on improving. As a whole, the divide between Europe and its Neighbours has rather decreased in the 2000s. Mediterranean Neighbours seem to benefit from their long run effort in education, even though they confront many remaining qualitative shortcomings in that field. Life expectancy is improving in Eastern Neighbourhoods but for Russia only and from a low level; the picture remains worrisome particularly for men. The bad situation of the whole Ukrainian territory except Kiev City proves that insufficient human development is a major component of the country ongoing crisis.
In Russia, Ukraine, and Egypt, local records more or less equal national values, despite some peculiarities such as Belgorod Russian oblast at the immediate north-eastern periphery of Ukraine (this territory hosts energy and in particular nuclear activities, with high salaries and educated people). But in other countries, internal disparities are confirmed, particularly in Tunisia and Turkey, where territorial planning and regional development appear obviously as key issues.
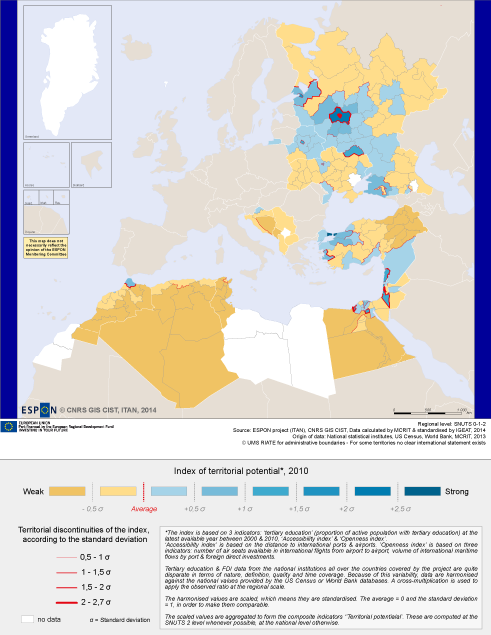
The Territorial potential is a composite indicator set up in the ITAN project. It combines tertiary education, territorial accessibility, and international openness. Assets appear clearly in the East –read Russian and not Ukrainian– rather than in the South, with Turkey as an intermediate position and with, again, an internal high heterogeneity. Moscow and Israeli territories are far ahead, but several territories in upper Nile Egypt show up. Maghreb, meanwhile, is lagging behind.