ITAN in brief n. 12 – Measuring the international openness of Neighbour territories, October 2014

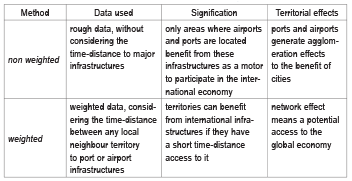
Two complementary methods for assessing international openness
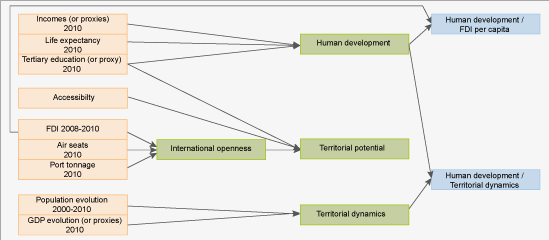
The ITAN report proposes two different international openness indexes –both methods are justified from a theoretical point of view and give a coherent index of international openness (Table 1):
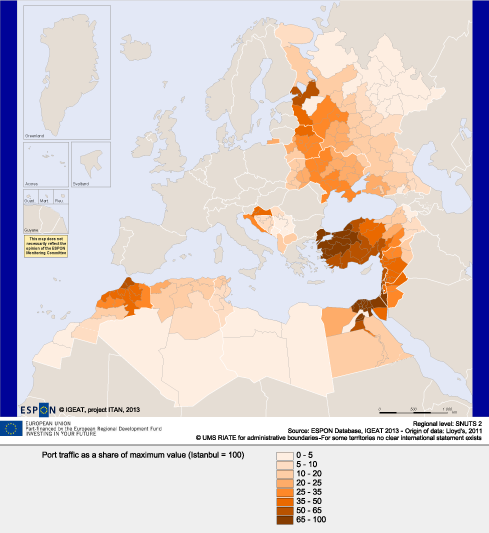
There are two keys of interpretation of Map 1: country effect and metropolitan effect. First, bigger and/or more developed countries generally show a higher internationalisation; this was an expected result. However, the strong concentration in the first city of the country is tempered by the geography of major ports, often located in other cities, which is an important pattern of the Neighbourhood geography.
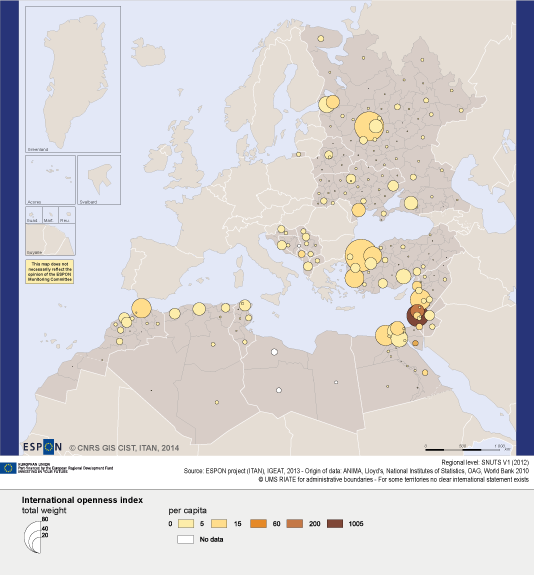
Map 1 also takes into account the demographic size of territorial local units. This highlights:
⇒ The international openness of Israeli territories;
⇒ The low international openness of North African territories although their potential accessibility to the (close) European territory is high. This suggests important avenues for territorial development there, to take better advantage of these North African territories situation;
⇒ The strong position of the Istanbul large urban region is all the more impressive that it is not only due to maritime flows but also to air flight and foreign investment;
⇒ In Russia, the overarching dominance of Moscow appears clearly.
Weighted international openness
The ITAN report also computed weighted indicators of maritime and air connections by considering the time-distance between any local territory (SNUTS 2 or 3) to port or airport infrastructures and taking into account infrastructures located within the EU space. For the time-distance, real networks speeds have been considered as well as border delays.
What is striking is:
⇒ The good index in the Near-East dense coastal areas and along the Lower Nile valley;
⇒ But the low performance, again, of Maghreb territories (except in northern Morocco for ports on Map 3);
⇒ Also the low performance of the Western Balkans (except Croatia for maritime openness);
⇒ This reveals important avenues for further transport development in these parts of the Neighbourhoods, namely for better logistic connection between ports and hinterlands;
⇒ Maps confirm the strong position of the major part of Turkey, except the Eastern part of the country;
⇒ Long distances penalise many Russian territories.